K-COSMOSKumaraguru Climate Observatory and Sustainability Monitoring System
Tracking GHG emissions and sustainability progress by monitoring campus energy, water, waste, biodiversity and community outreach impact.
Real-time climate conditions across the Kumaraguru Institution campus — temperature, humidity, rainfall, wind and pressure — streamed live from the on-site Aeron sensor station, with air quality shown as supporting context below.
Last 24 hours
Last 24 hours
Supporting context — shown at lower priority than the climate parameters above.
Last 24 hours
Particulate matter, last 24 hours
Explore Kumaraguru Institution's Greenhouse Gas (GHG) Report to understand our campus carbon emissions. Tracking emissions helps us identify key emission hotspots and prioritize effective climate action strategies.
Split of emissions produced by all factors.
Monthly breakdown stacking all emission sources.
Explore Kumaraguru Institution’s electricity consumption trends including usage patterns over time and the contribution of grid and renewable energy sources to total consumption supporting Kumaraguru Institution’s drive for greater energy efficiency and sustainability.
Electric (kWh) by Month and Year
Published activity and governed calculation fields from immutable releases. Missing emissions and factors remain unavailable.
Explore Kumaraguru Institution’s waste management data, highlighting waste generation, diversion, and disposal patterns to analyze trends in resource management efficiency and strengthen Kumaraguru Institution’s ongoing waste reduction initiatives.
Explore Kumaraguru Institution’s water consumption trends, showing usage patterns over time, the contribution of different water sources and the total volume of water recycled to boost Kumaraguru Institution’s ongoing water conservation initiatives.
Water drawn (KL) by month
Share of consumption by source
Monthly trend (KL)
Monthly trend (KL)
Monthly trend (KL)
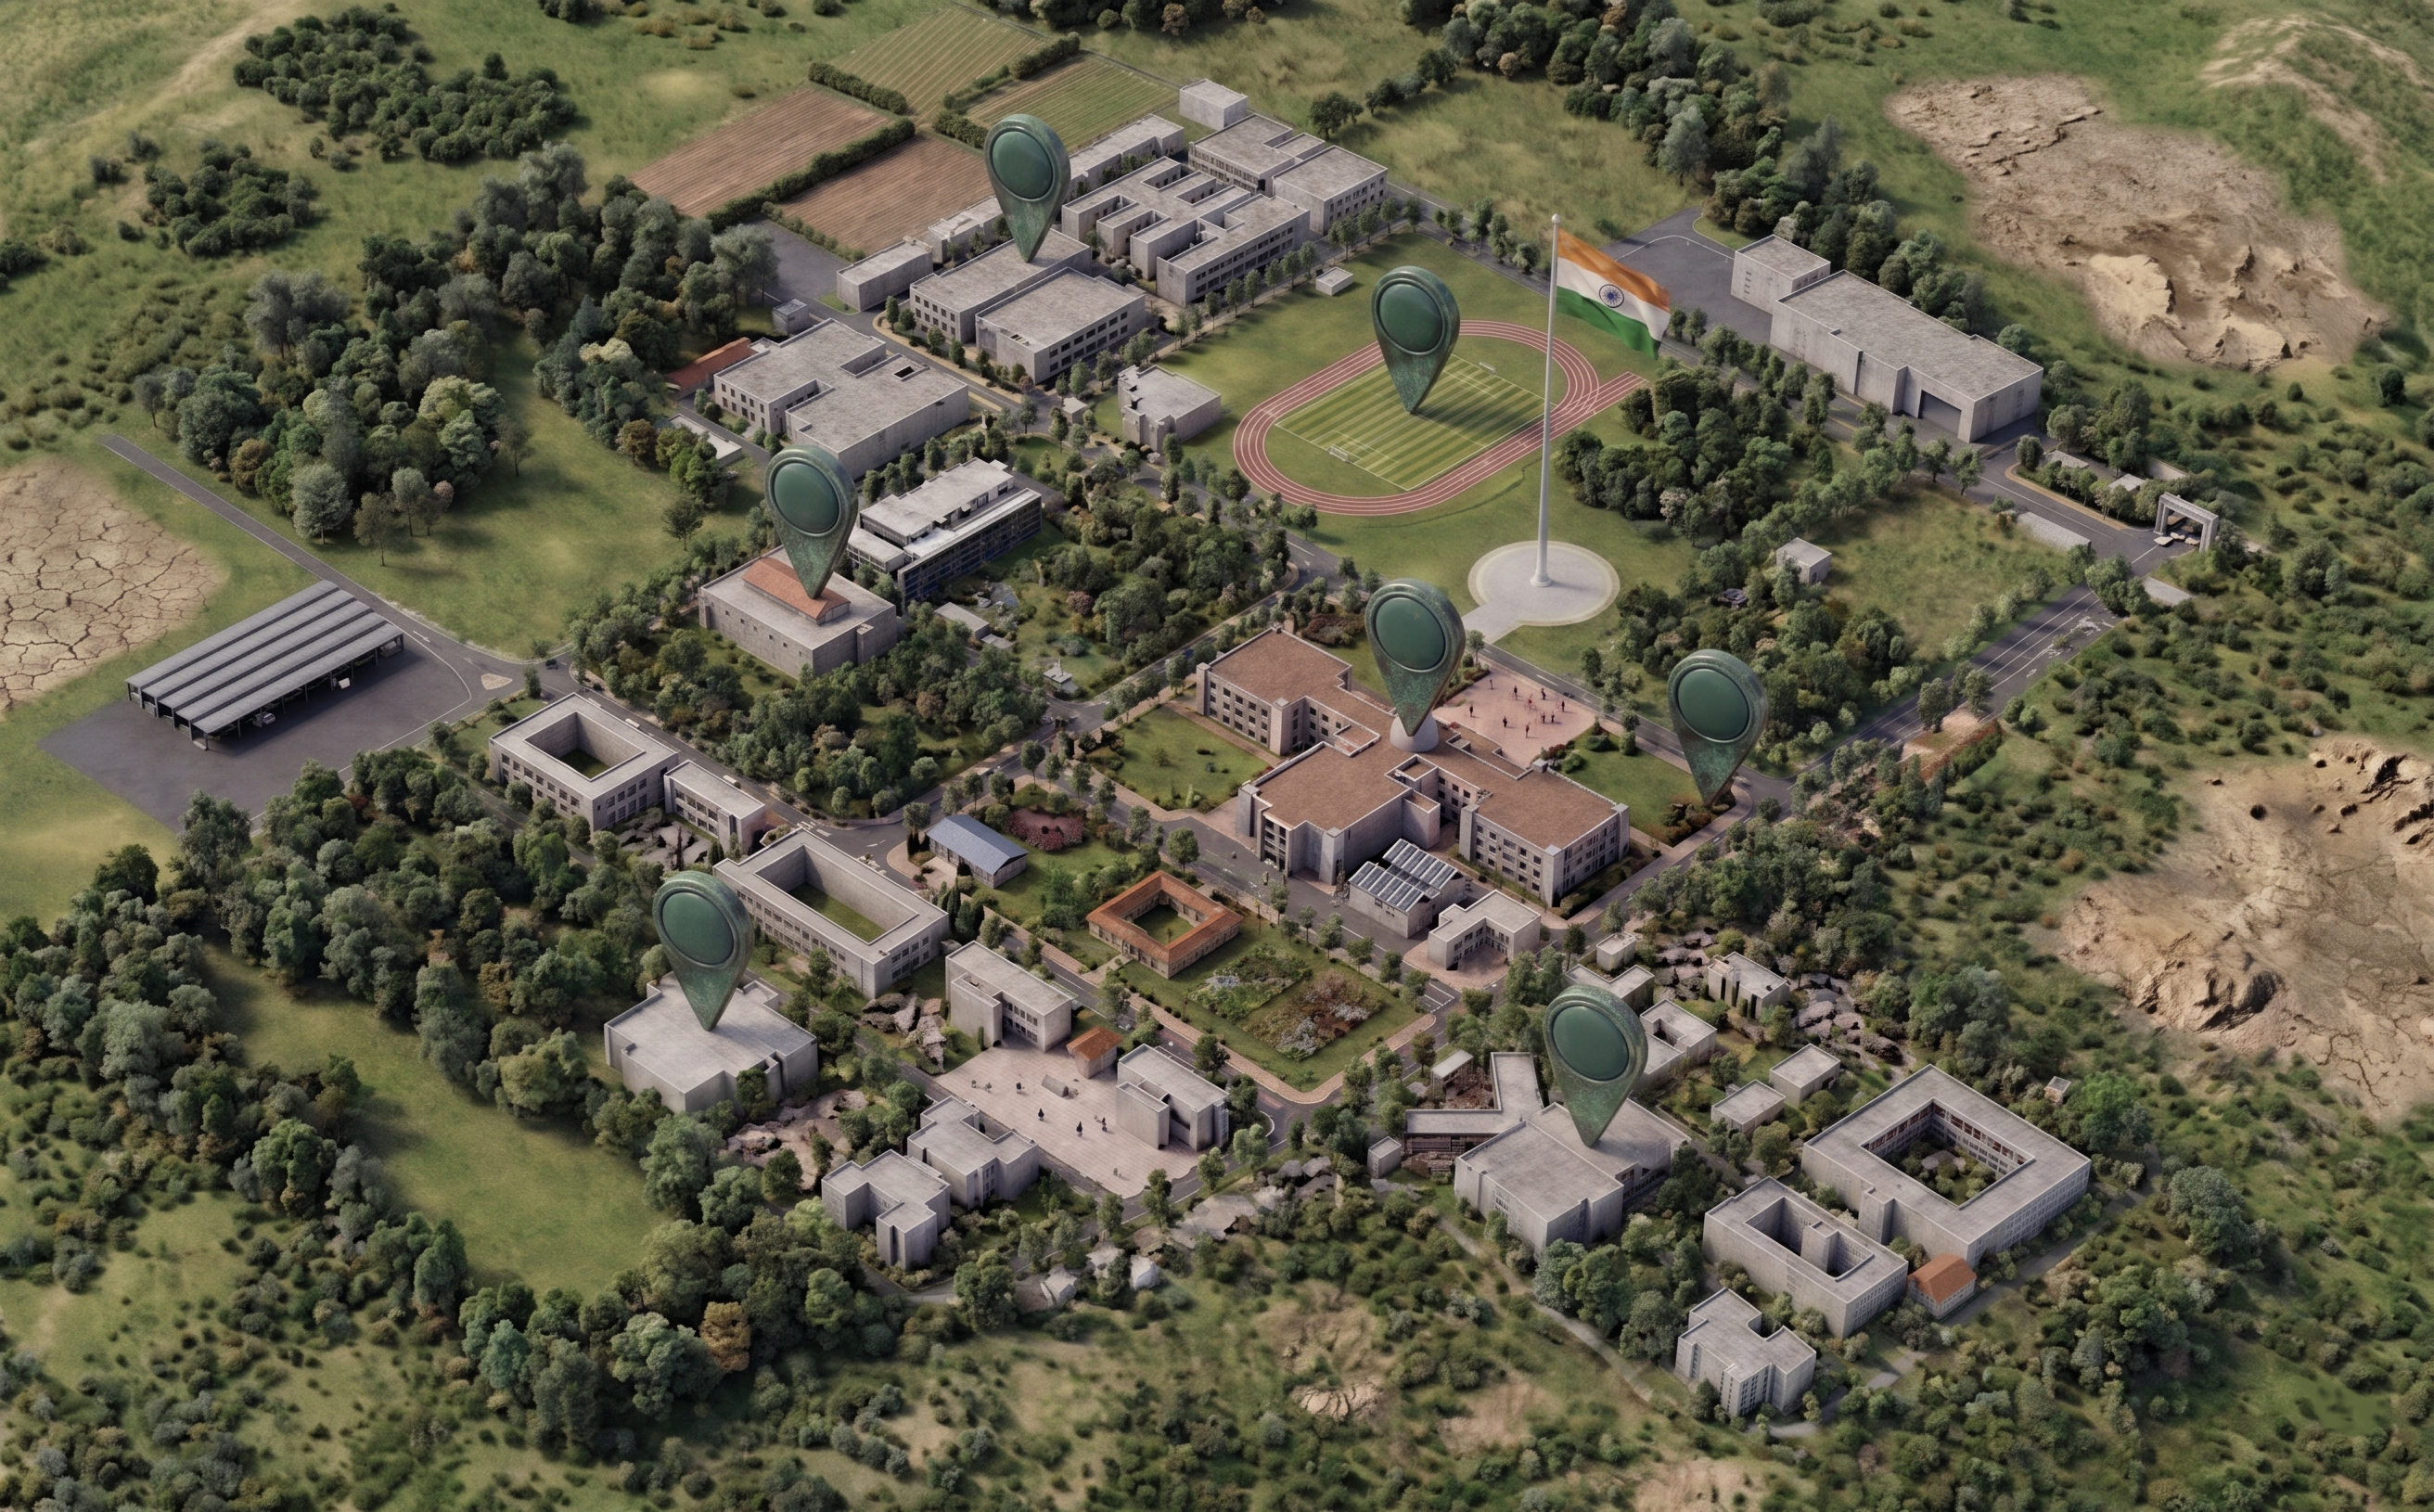
Kumaraguru Institution campus with its 150 acres and thousands of trees aspires to be an ecosystem that is ecologically enriching
Hover (or tab to) a marker to see the trees and species recorded in that zone
Kumaraguru Institution’s community outreach fosters environmental awareness and social responsibility, creating lasting impacts through collaborative sustainability initiatives.
Approx. reach per audience - hover a slice for the figure
Participant gender split
Programmes delivered per theme - hover a slice for the count
The K-COSMOS (Kumaraguru Climate Observatory and Sustainability Monitoring System) presents a data-driven overview of the environmental performance of Kumaraguru College of Technology. The dashboard monitors key indicators such as:
These insights help strategize institutional sustainability initiatives and guide Kumaraguru Institutions toward achieving long-term environmental goals.
The data presented on this platform is collected from various operational departments of the college, including:
| Source | Description |
|---|---|
| Fleet Fuel Usage | Petrol and diesel consumed by college vehicles |
| Diesel Generators | Fuel used in backup DG sets |
| Grid Electricity | Power drawn from the electricity grid |
| Renewable Energy | On-campus renewable generation (solar, wind, etc.) |
| Water Consumption | Campus-wide water usage records |
| Waste Generation & Diversion | Waste produced and diverted from landfills |
| Field Surveys | Total green cover and community outreach impact assessments |
All collected data is transformed into a series of visual representations, helping users explore Kumaraguru Institution's sustainability efforts and understand how the institution is progressing toward a more sustainable future.
A Phase 1.4 public release reports a bounded operational indicator derived by the backend from frozen, governed calculation results. Scope 1 includes Petrol, Transport Diesel, DG Diesel and LPG CO₂e; Scope 2 is grid electricity CO₂e. The combined value is not a complete Scope 3 or universal institutional GHG inventory. Estimated avoided grid emissions are reported separately, not subtracted from Operational GHG. Waste emissions and Green Cover carbon sequestration are outside the current inventory boundary. Earlier immutable releases may not contain the Phase 1.4 indicators and will show those values as unavailable.
| Term | Definition |
|---|---|
| Scope 1 Emissions | In this public contract, Scope 1 is the published sum of Petrol CO₂e, Transport Diesel CO₂e, DG Diesel CO₂e and LPG CO₂e. If any required frozen component result is missing, Scope 1 is unavailable. |
| Scope 2 Emissions | In this public contract, Scope 2 is the frozen published CO₂e result for grid electricity. |
| Term | Definition |
|---|---|
| Activity Data | A quantitative measure of an activity that results in a GHG emission or removal over a specific period. Examples: liters of fuel consumed, kilowatt-hours (kWh) of electricity used, distance traveled in kilometers, or mass of waste generated. |
| Renewable Energy | Energy derived from natural, non-fossil sources that replenish faster than they are consumed. Examples: wind, solar, hydro, geothermal, ocean/tidal, and sustainably sourced biomass. |
| Operational GHG Emissions | The published Scope 1 + Scope 2 result for the reporting period. It is not presented as a complete institutional footprint. |
| Operational GHG per capita | The backend-published Operational GHG result converted to kilograms and divided by the governed population reference for that reporting year. |